In the six weeks after the San Francisco Bay Area instituted the nation’s first shelter-in-place mandate in response to the growing COVID-19 pandemic, regional carbon dioxide emissions dropped by 25%, almost all of it due to a nearly 50% drop in road traffic, according to new study from the University of California, Berkeley.
Though emissions have steadily increased since then, the dramatic response to a sharp cut-off in vehicular fossil fuel burning shows how effectively a move toward broad use of electric-powered vehicles would reduce the major greenhouse gas responsible for climate change and global warming.
The data come from a network of carbon dioxide sensors set up around the Bay Area by UC Berkeley scientists over the past eight years — a network that is already being replicated in several cities around the world. Glasgow, Scotland, will announce tomorrow (Nov. 10) that it plans to install 25 of these monitors within the next year in time for the Nov. 1, 2021, start of the United Nations Climate Change Conference in that city.
“This is what it would look like for CO2, if we electrified the vehicle fleet,” said Ronald Cohen, UC Berkeley professor of chemistry and of earth and planetary science and senior author of the study. “The implication is that emissions on the roads could be changed quickly and dramatically by policy, and we have a tool to follow that relatively quickly. This is the way to know we are on track to meet our goals.”

Weekly carbon dioxide concentrations during the six weeks before shelter-in-place (Feb. 2-Mar. 14, purple) and six weeks during shelter-in-place (Mar. 22-May 2, green). The solid lines show the median CO2 levels across the BEACO2N network. (UC Berkeley graphic by Ronald Cohen)
Cohen is participating in a webinar about the project tomorrow, 8-11:45 a.m. PST, along with Mary Nichols, chair of the California Air Resources Board, and Glasgow and Scottish leaders. He and his colleagues reported the results of their Bay Area study in a paper posted online Oct. 30 in the journal Geophysical Research Letters.
The state of California has already banned the sale of gas-powered vehicles by 2035 and has set a goal to reduce state carbon dioxide emissions by about 3% each year for the next 10 years. A statewide network like the small-scale network Cohen set up — the Berkeley Environmental Air-quality & CO2 Network, or BEACO2N — would be able to track CO2 emissions and demonstrate to legislators and the public that these efforts are effective at reducing greenhouse gases.
“We are making the case that this is the way to track urban CO2 in cities all over the world,” he said. “We are trying to figure out what combination of tools make this routine enough to transfer to government agencies that would track this, or to private companies that might provide those services to government agencies in a way that is efficient at scale.”

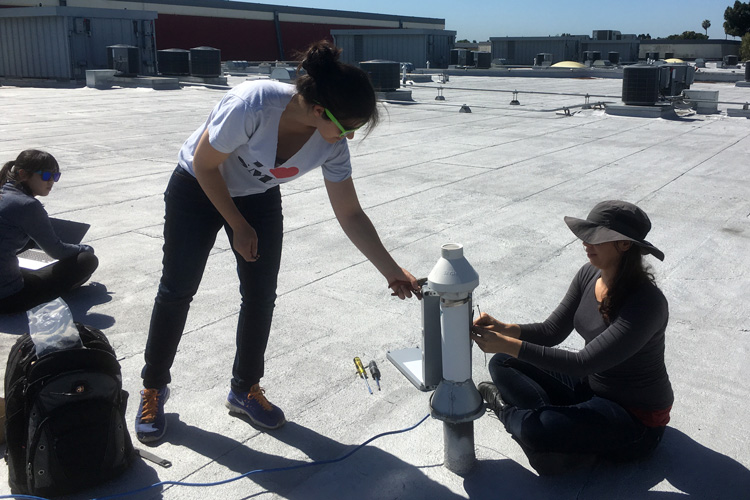
(L to R) Jinsol Kim, Alexis Shusterman and Catherine Newman, all of whom have now earned a Ph.D. from UC Berkeley, installing pollution sensors atop a high school in Richmond, California. (UC Berkeley photo by Kaitlyn Lieschke)
Cohen noted that no government agency routinely tracks urban carbon dioxide emissions on the ground. The federal Environmental Protection Agency (EPA) is responsible for tracking such things as ozone, NOx and particulates, but not CO2: The greenhouse gas was not one of the “criteria pollutants” the EPA was tasked with monitoring and regulating as a result of amendments in the 1970s to the 1963 Clean Air Act. The EPA in 2009 invoked the so-called endangerment clause to regulate CO2 emissions, but the Trump administration filed a lawsuit to repeal the regulation.
“It is almost silly that we weren’t measuring CO2 from the start, in the EPA network, because almost all of the sources of these pollution gases are burning fuels,” Cohen said. “We measure those pollution gases, but we don’t have the data in the atmosphere to say how much fuel was burned. One of the advantages of the approach we are taking is that you can imagine, nationally or internationally, merging the CO2 and the air quality emissions inventories into a single set of data and providing simultaneous air quality and CO2 analyses, much like what the National Weather Service does for ordinary and severe weather.”
BEACO2N
The locations of the three dozen sensors in the BEACON network employed in this study. There are a total of 72 sensors located around the Bay Area. (UC Berkeley image by Ronald Cohen)
Nearly a decade ago, Cohen set out to find a way to measure pollutants, including carbon dioxide, inexpensively enough to deploy on the neighborhood level. Per site, EPA stations can cost around $200,000, and they don’t even come with CO2 sensors.
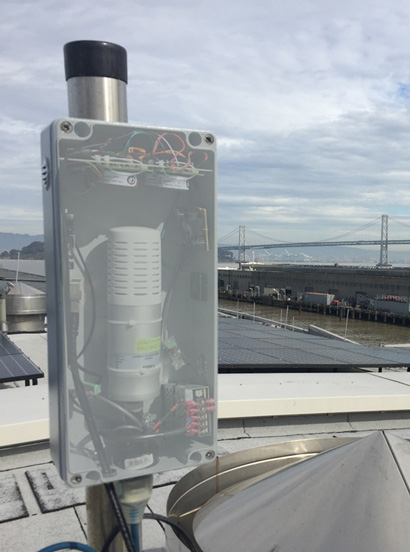
Using new technology several notches better than the carbon monoxide and carbon dioxide sensors in our homes, he is now able to build — for $8,000 — a package the size of a shoebox that every 5 seconds record levels of CO2 and four common gaseous pollutants that contribute to smog — carbon monoxide (CO), nitrous oxide (NO), nitrogen dioxide (NO2) and ozone (O3) — as well as particulate levels, such as the smoke that recently enveloped the Bay Area from fires in Northern California.
Over the past five years, he has deployed 72 of these instrument packages around the Bay Area as part of BEACO2N. Most of the networked nodes are in Oakland, Richmond, Vallejo and along the I-80 corridor, typically spaced about 2 kilometers — slightly over a mile — apart. Schools are favored sites, because his team can engage with students and teachers studying science, and he can tap into their Wi-Fi systems to send data in real time to his laboratory, where they are posted online. He and his team have also installed four stations in San Francisco, including two at the Exploratorium, and are collaborating with colleagues elsewhere to build similar networks in Los Angeles, New York City and Houston, as well as in Glasgow.
Cohen’s goal is to provide governments and policymakers with the feedback they need as they try to reduce pollutants and greenhouse gases. By placing them regularly throughout the area, he also hopes to show how reducing pollutants affects every community, especially lower-income communities that suffer too often from the unhealthiest air along freeway corridors and near power plants or refineries.
“From an environmental justice perspective, the question is, ‘If we control CO2, do we do that in an equitable way?’” he said. “With cap and trade in California, for example, it wouldn’t be right if rich people shut down facilities close to them first and shifted that extra burden to where poor people live. A BEACO2N type of network would be a way of tracking those things.”
Cap and trade — a government regulatory program common in Europe, China and Canada and employed in 10 U.S. states, including California — is a way of encouraging companies to reduce their carbon dioxide emissions. Specific companies are given a limit, or cap, on the amount of CO2 they can emit, but are allowed to sell, or trade, their emission allowances to other companies if they reduce their own emissions.
Today, many cities also have climate action plans, yet they lack the data to monitor their success, Cohen said. Carbon dioxide levels around the globe are measured by NASA’s Orbiting Carbon Observatory satellites and Japan’s Greenhouse Gases Observing Satellites, but only on a regional level, not city by city.
“Our goal is to give people data to support what they are doing, so they can make judgements about what works effectively,” Cohen said.
A natural experiment
On March 16, six counties in the Bay Area became the first region in the U.S. to tell non-essential employees to stay home to stop the spread of COVID-19. Cohen saw this as an opportunity to see what happens when the use of gas-fueled cars plummets.

Carbon dioxide levels are highest along freeways because they come predominantly from vehicles. The color intensity shows how the concentrations decreased after shelter-in-place. (UC Berkeley image by Ronald Cohen)
Tapping measurements from the BEACON network, Cohen and his colleagues compared the six weeks before shelter-in-place — Feb. 2 through March 15 — with a six-week period afterward, March 22 through May 2. Thirty-five of the sensors were operational throughout that time. The team corrected for the substantial uptake of CO2 by plants in the spring and used meteorological models to extrapolate the point-source measurements to the greater Bay Area.
The team found the greatest reduction in CO2 levels during the Monday through Thursday morning rush hour, at around 7 a.m., along the major freeways, with the greatest improvement along I-880 running through Northern Oakland. Overall, human-caused CO2 levels dropped 30% after shelter-in-place restrictions limited mobility. Monitors near freeways showed that most of this decrease came about as a result of a 48% decrease in vehicular traffic. About 8% of the decrease in carbon dioxide was ascribed to diminished emissions from stationary sources, such as refineries.
During normal times, there is a large bump in CO2 emissions during the morning rush hour and a lesser bump during the evening rush hour, but these daily differences became less pronounced.
Such data are not available from other monitoring systems, though a citizen science network, Purple Air, sells home air quality sensors for $250 or more that measure particulates, like smoke or dust, which have been shown to increase the risk of respiratory illnesses and cardiovascular disease. Carbon dioxide emissions, on the other hand, are estimated from the amount of fuel consumed by human activity.
A recent study used such estimates of human activity to document that, during the pandemic, cities around the world saw a drop in CO2 emissions. Authored by UC Berkeley’s Daniel Kammen and numerous colleagues in China, the study estimated that there was an abrupt 8.8% decrease in global CO2 emissions in the first half of 2020.
Networks like BEACO2N are an accurate and affordable way to get much better data at the neighborhood level.
“Here we would have a direct measure,” Cohen said. “Going forward, we expect that direct observations of CO2 will help us refine an understanding of the emissions that are contributing to air pollution and, simultaneously, the air pollution emissions will help us refine our understanding of the emissions of CO2.”
Cohen’s coauthors are Alexander Turner, now at the University of Washington in Seattle; Jinsol Kim, Helen Fitzmaurice, Catherine Newman, Kevin Worthington, Katherine Chan, Paul Wooldridge of UC Berkeley; and Philipp Kohler and Christian Frankenberg of the California Institute of Technology in Pasadena. The UC Berkeley work was funded, in part, by the Koret Foundation.
RELATED INFORMATION
"electric" - Google News
November 10, 2020 at 03:41AM
https://ift.tt/3eLuQIS
Drop in pandemic CO2 emissions previews world of electric vehicles - UC Berkeley
"electric" - Google News
https://ift.tt/2yk35WT
https://ift.tt/3bbj3jq

No comments:
Post a Comment